
The Storm Prediction Center out of Norman, Oklahoma highlights the areas of the United States that may see severe thunderstorms each day. It’s called the Convective Outlook. You’ve likely seen the map before that shows the different thunderstorm risks with attached categories like “marginal”, “slight”, “enhanced”, etc. Here’s an example of one of those maps:
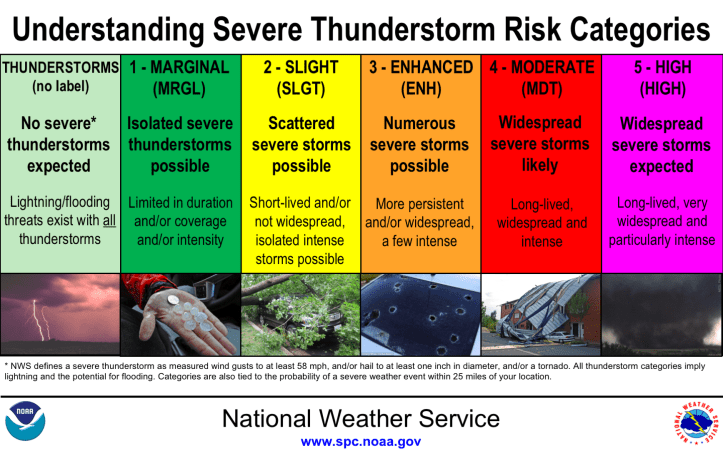
While it’s easy to tell that the yellow and orange area likely has the greatest chance for severe storms, let’s break it down into easier-to-understand categories and IMPACTS rather than words like “slight” or “enhanced”. Here’s a chart that helps break it down:
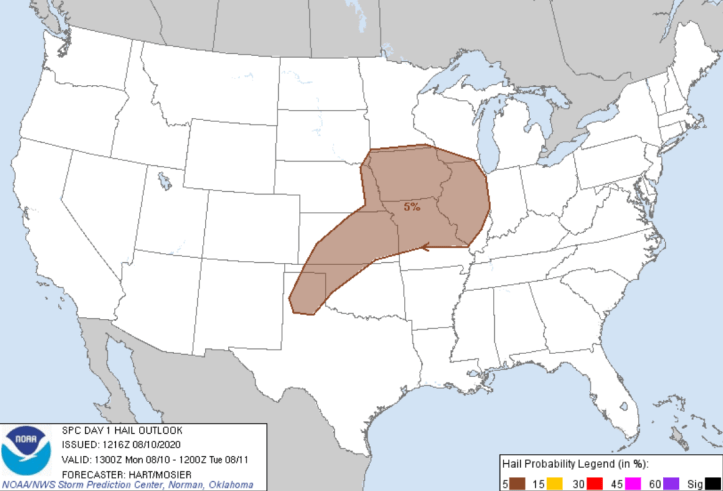
While severe weather outlooks go up to a week out, they’re typically broken down into the most accurate timeframes of 1-3 days (called Day 1 Outlook, Day 2 Outlook, etc). They also break down the risk for damaging winds, large hail, and tornadoes into individual categories each day. Here are examples of each:
Severe Wind Risk

LARGE HAIL RISK
TORNADO RISK

We typically break these risks down for you in our forecasts so you don’t have to comb through charts and maps. We also like to use different wording to explain severe weather risks–but that’s just our preference as we assume it’s easier for people to understand. Example: We have a slight risk for severe storms today becomes “severe storms are likely today”.
An example:

It’s the little things here at Region Weather, but we hope this helps to explain some of the maps we show and risks associated with severe weather events!
