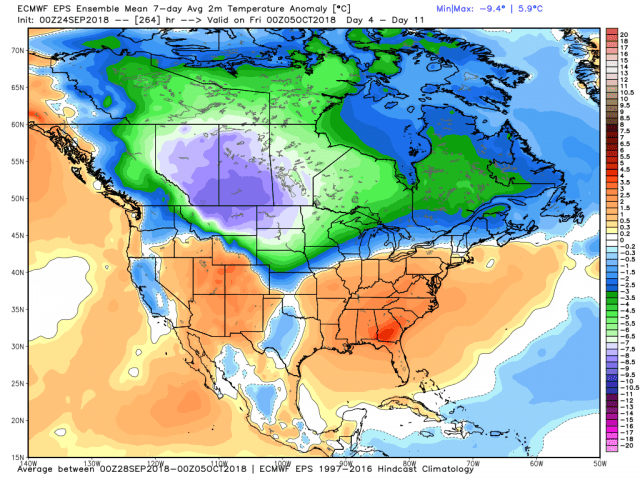
After a warm September, the pattern looks to flip and bring us a potentially chilly October here in NWI. Take a look at what the models are saying. The following maps show the departure from average in terms of overall weekly temps. The green and blue colors are below average and the reds and oranges are above average.
First week of October:
Second week of October:
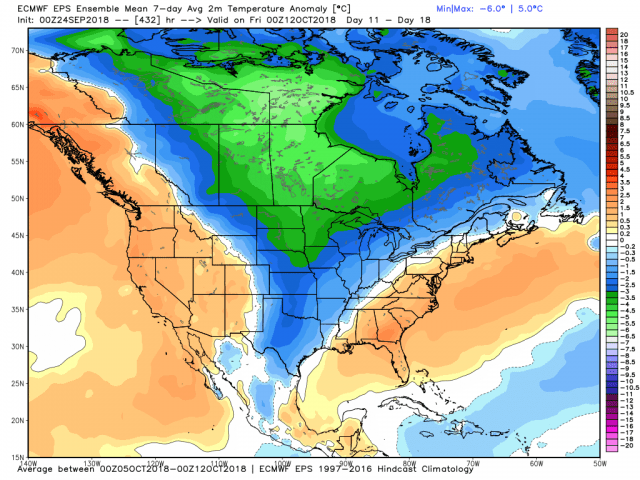
Third week of October:

Last week of October:
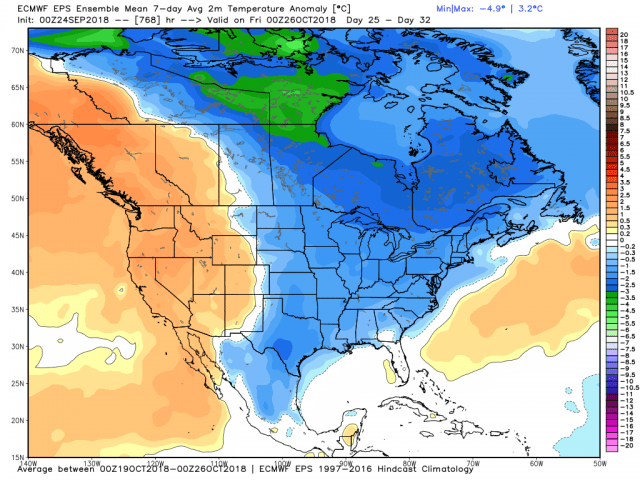
First week of November:
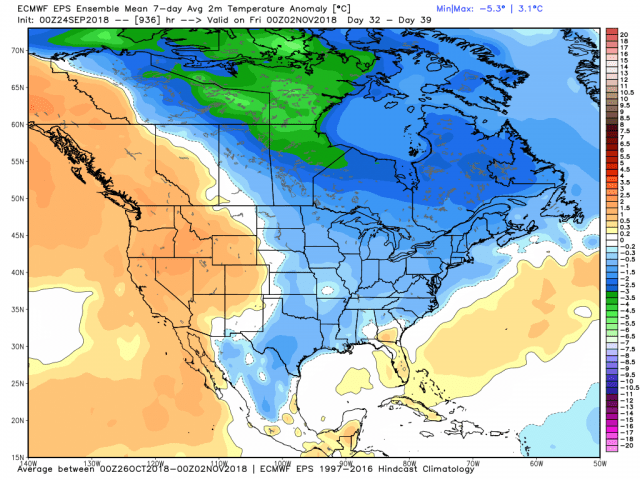
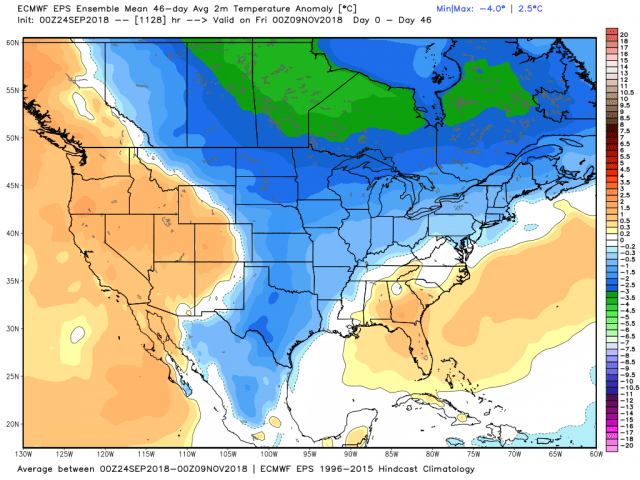
Overall the next 6 weeks:
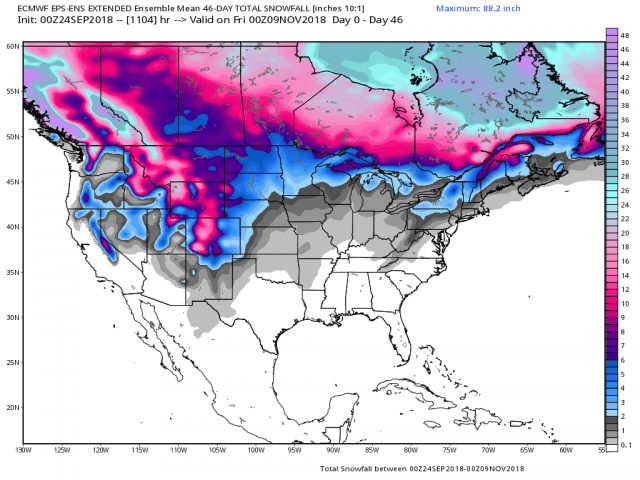
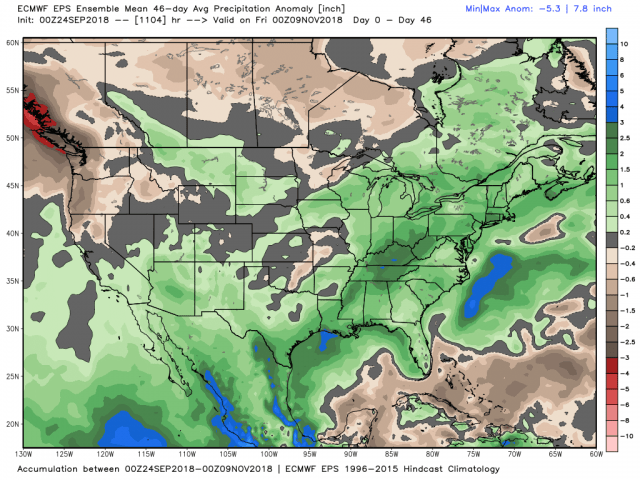
In terms of precipitation, it looks like the eastern half of the US will continue it’s wet trend with above average rainfall. Towards the end of this forecast period we need to start looking at…snowfall…as well.
6 week precipitation forecast:
It’s already and will continue to be a COLD start to the fall season for much of Canada. They already have an early season snowpack and this will only grow over time–perhaps setting the stage for an earlier than average snowfall here in the Region. Time will tell!
6 week snowfall forecast: